
Land values
Why are we interested in land values?
Land values are part of the complicated formula driving house prices, especially for new build homes.
Our local housing market bulletin, available here published in September 2018 highlights the difference between new build and "second hand" house and flat prices. The gap varies a lot across the eight districts in our area, so we thought maybe finding and sharing data in an "open" format might help show some patterns.
What is viability about?
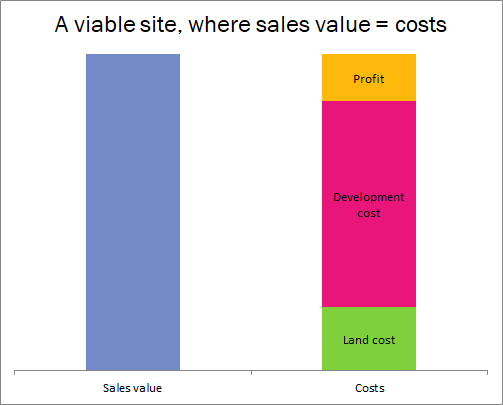
There are three main elements when working out viability of a housing site to develop, which are;
- Land cost
- Development cost
- Profit
Put simply, if the sales value of the homes built, equals or exceeds the total land and development cost, plus an acceptable level of profit for the developer, it is viable. Obviously the formula is more complicated in "real life" but this provides a start point to gathering data which might help us analyse how homes are (and are not) viable to develop in our eight districts.
One major factor is the price of land, and when researching the data published nationally, we found some goverment information, published by district across England, for three years. The data is provided by the Valuation Office Agency and there are some caveats - but it forms a start-point to understanding our local situation, and the part land value plays in the "viability formula".
What data have we published?
We have re-published three years' data on land values, produced by the Valuation Office Agency and published by the government for 2014, 2015 and 2017. You can preview the data below or alternatively, you can download it here.
Why have we published it?
We have tried to add value to the MHCLG published data, because the goverment data for 2014 and 2015 is in a report format, while 2017 is provided in a spreadsheet with explainatory notes in a separate report. We wanted to make the data more useable, so although it has heavy caveats and notes on its application, we can at least compare the 3 years of data side-by-side, as it follows the same methodology in all three years.
Some notes on the data
The data contains land value estimates for policy appraisal, with residential land value estimates by local authority and average industrial and agricultural values for England. This includes an estimate of a ‘typical’ residential site in each of England’s local authorities.
Values of individual sites are highly sensitive to plot-specific characteristics and the report does not present estimates of market value.
As a result the estimates are not suitable for use other than for policy appraisal.
The values show post-permission residential land value estimates, per hectare.
Does it help?
The table shows the 3 years' data for some local districts, side by side.
|
£/ha |
2014 |
2015 |
2017 |
|
Cambridge |
£5,725,000 |
£5,655,000 |
£5,955,000 |
|
East Cambs |
£1,035,000 |
£1,365,000 |
£2,130,000 |
|
Fenland |
£370,000* |
£370,000* |
£485,000 |
|
Huntingdonshire |
£1,495,000 |
£1,730,000 |
£2,450,000 |
|
South Cambs |
£3,225,000 |
£4,285,000 |
£5,300,000 |
|
Peterborough |
£1,185,000 |
£1,190,000 |
£1,780,000 |
* In a number of districts schemes did not produce a positive land value in the model. A ‘reserve value’ of £370,000 has been adopted in districts outside London where this applies, to represent a figure at less than which it is unlikely (although possible in some cases) that one hectare of land would be released for residential development. This has been taken on a national basis and clearly there will be instances where the figure in a particular locality will differ based on supply and demand, values in the area, potential alternative uses etc. and other factors in that area.
What next?
As and when more data is published we can add that, and see how trends may be changing according to the Valuation Office Agency.
In the meantime we will seek out data on development costs and average levels of profit, alongside any other factors to be aware of around viability.