
Housing Completions across Cambridgeshire 2011-2021

In this data story, we highlight some of key findings from Cambridgeshire’s 2020/21 housing completions data.
The data was gathered through site visits and cleaned by CCC Business Intelligence team. This is then uploaded to Cambridgeshire Insight which includes a range of data relating to the number of new dwellings completed by district, parish, settlement, bedrooms, previously developed land, affordability and density.
If you have any questions regarding the data story or the data used, please contact research.group@cambridgeshire.gov.uk

The graph above highlights the number of completed dwellings built in Cambridgeshire in each financial year between 2011/12 and 2020/21. In 2020/21, there were 3511 completed dwellings, completions have been reasonably consistent for the last four years. This is higher than the low levels seen in 2011 and 2012 following the financial crisis of 2008.
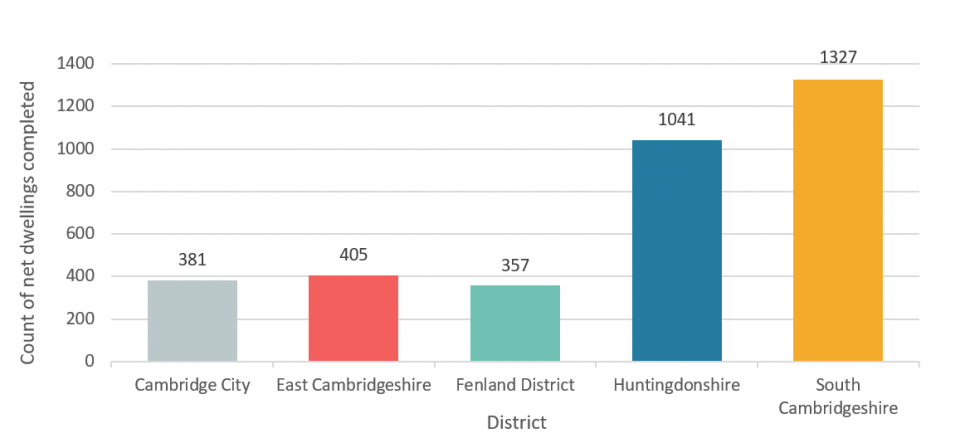
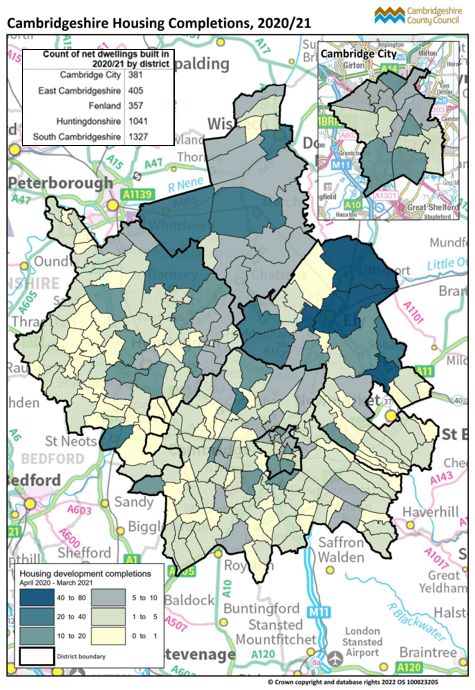
The graph above shows the number of net dwellings built in 2020/21 financial year by district. The number of new dwellings were concentrated in Huntingdonshire and South Cambridgeshire at 30% and 38% respectively of the county total. For South Cambridgeshire, this is 8% higher than last year’s completions. Fenland accounted for 10% of housing completions in 2020/21.
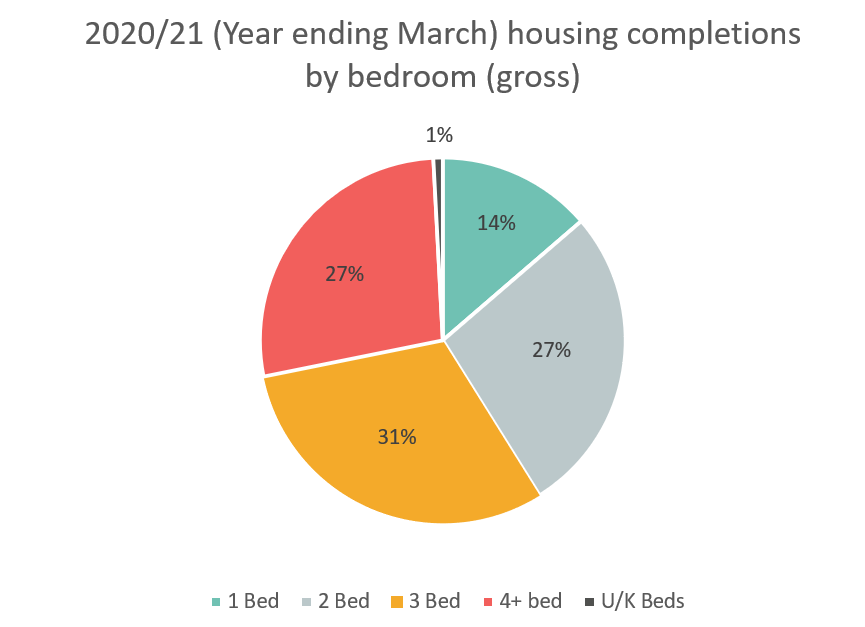
The pie chart above shows the proportion of gross dwellings completed in Cambridgeshire in 2020/21 by number of bedrooms. The largest number of dwellings completed were 3 bedrooms at 31%. This is similar to last year’s housing completions. However, when compared with 2011/12, the largest number of dwellings completed were 2 bedrooms.
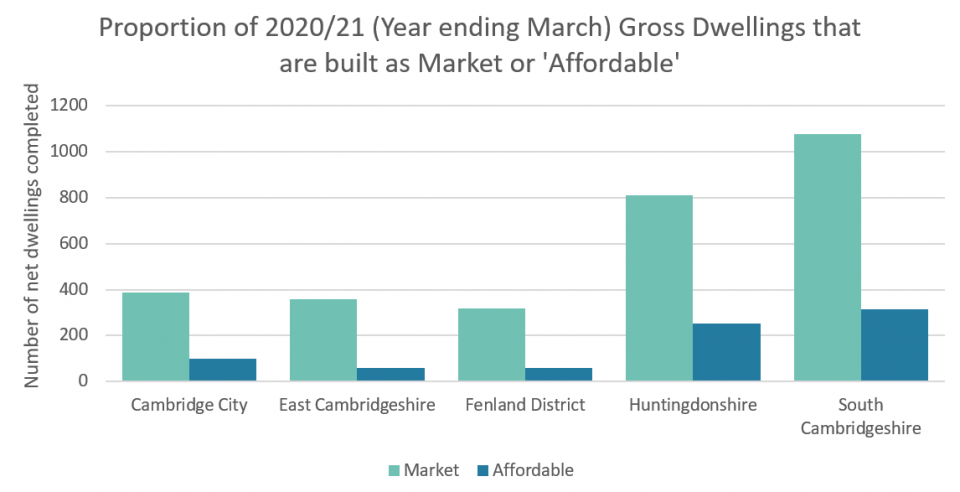
The chart above highlights the proportion of gross dwellings that are ‘affordable’ or market housing by district. Affordable housing is for those whose needs are not met by the market, it includes different tenures, including social rent, affordable rent and shared ownership, among others. The highest proportion of homes that are affordable in 2020/21 are in Huntingdonshire and South Cambridgeshire with 24% and 23% respectively. The lowest proportion of ‘affordable’ dwellings was in East Cambridgeshire at 14%.
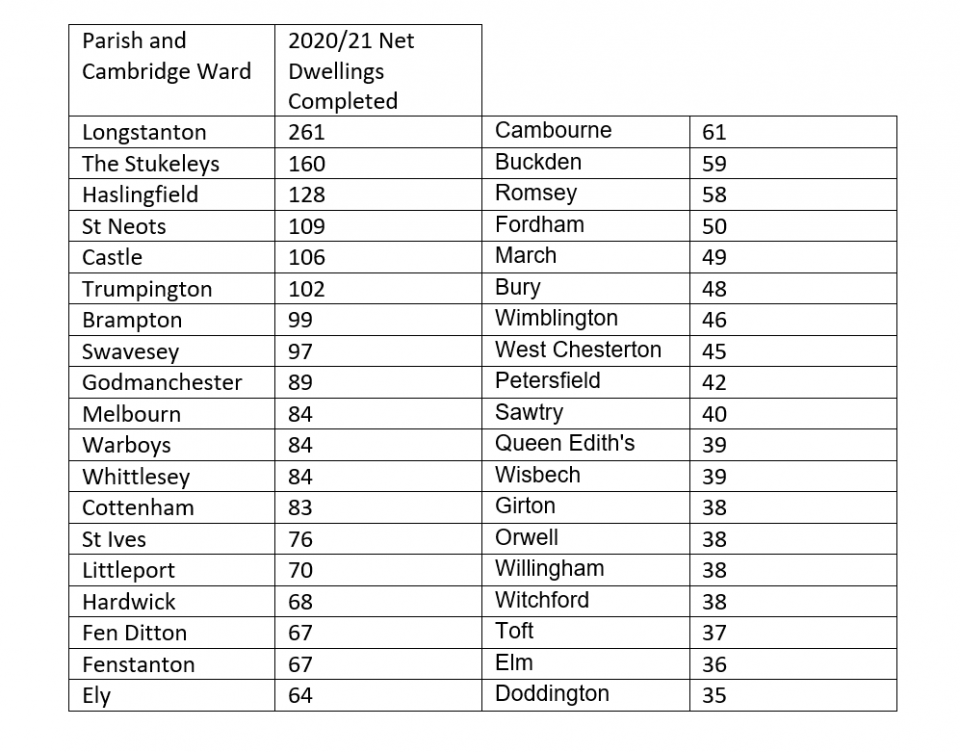
Above is a table highlighting the top 40 parishes and wards with the highest number of completed dwellings in 2020/21. Longstanton and the Stukeleys had the highest number of dwellings completed at 261 and 160 each. However, it should be noted that most new builds in these two parishes are in Northstowe and Alconbury Weald. These are strategic developments that will have 10,000 and 5,000 homes respectively built when completed. As of 2022, Northstowe is now its own parish with its own parish boundary.
To further explore and visualise 2020/21 housing completions we used a thematic map to highlight which parishes and Cambridge wards had the highest numbers of completed housing developments. These developments can range from a single dwelling to large housing estates. Locations such as Trumpington on the Cambridge fringe, Whittlesey in Fenland, Ely in East Cambridgeshire, Longstanton in South Cambridgeshire and Ramsey in Huntingdonshire are a few areas with significant housing developments.
Click below for the dataset used and more information on cambridgeshires housing, renewables and business monitoring.