
Data visualisation: A crime map of Cambridgeshire by Adele Gilpin
“Data is the new oil…” is a phrase often used by those in the industry to describe the vast, valuable and extremely powerful resource available to us. We generate an astronomical amount of data, in fact 90% of the data in the world today has been created in the last two years alone according to IBM. However, there is a real skills gap when it comes to working with the data – people often perceive it as being too complicated or intimidating to work with, while those who can extract it, process it and refine it will reap the rewards.
Data is readily available if you know where to look for it. The UK Government’s data.gov.uk site opens up datasets on the environment, health and education and often these datasets come cleansed without the need to process it too much (though I would always advise the cleansing and scrutiny of data regardless of source!). As a Cambridgeshire resident, I am very lucky to have access to Cambridgeshire Insight Open Data, which is a repository of open data relating to local matters and is managed by Cambridgeshire County Council and run by a local partnership. I therefore wanted to have a go at playing around with the data and utilising the numerous free tools available to explore and visualise it with the hope of making it more accessible – let’s face it, there’s more to life than staring at a spreadsheet!
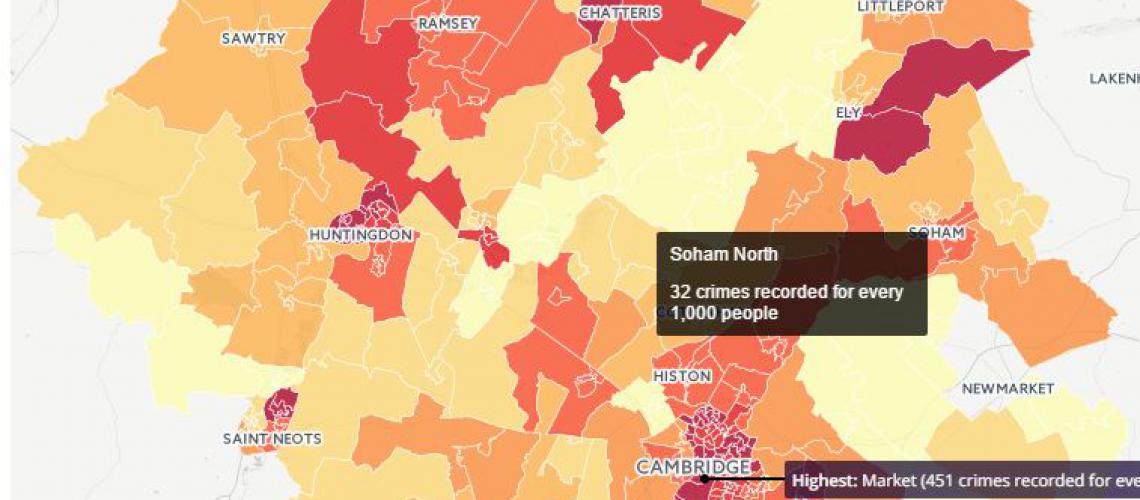
My first project will be looking at crime figures in the county and projecting them on to a map, by council ward, using an online tool called Carto. The data will be sourced from the Cambridgeshire Crime Rates and Counts 2015/16 data set on the Cambridgeshire Insight Open Data site and I will be focusing on the data related to the rate of crimes per 1,000 population at ward and district level. The data I’m using can be found in column “CU” in the Excel sheet .
The benefit of looking at the rate instead of raw numbers is that it means the stats aren’t skewed by heavily populated areas e.g. I would expect the number of crimes in heavily populated areas to be higher than those in remote rural communities, but as the rate takes in to account the population within the area, it provides a more accurate measure.
The mapping processes behind Carto aren’t sophisticated enough to recognise a council ward name in data (yet), but it does allow you to overlay KML data meaning that the wards can be “drawn” on to the map in a new layer. Where does this KML data come from? Surely we don’t have to create it ourselves? Heh, don’t be silly, someone has already done all of the hard work for us (phew!) – thank you to Alasdair Rae, a Lecturer in the Department of Town and Regional Planning at the University of Sheffield who created it for an article in the Guardian and a spreadsheet containing all of the KML shapes of all council wards in England can be downloaded via a Google Fusion table.
I then matched up the wards, by name, between the two sheets and pulled out the KML code for each one and the resulting sheet can be found here. From here, everything can be done from within Carto so create yourself a free account and prepare to be dazzled!
There are plenty of Carto tutorials but there are essentially two sides to the tool: the dataset side (where the data can be uploaded) and the mapping side (where the maps connect to your existing datasets). The great thing about Carto is that your maps can be embedded in your own website so hey presto, here’s the resulting map.
I hope to make this a regular series of small tutorials about data visualisation and the use of open data so check back in a few months to see what else I have been up to!
Disclaimer: Adele Gilpin is employed by Cambridgeshire County Council, though she has no links with the Insight Open Data team.
This article was originally published at http://www.neotists.co.uk/projects/data-visualisation-a-crime-map-of-cam...
![]()
The neotists are a collective for creatives in the St Neots and Huntingdon area. It started as an idea in 2015 as a way to bring designers, artists, illustrators and photographers together to kick-start a dormant creative community. They commission local creatives to collaborate on projects, run workshops and events for the community and provide opportunities and connections for professionals working in the creative industry. Find out more and how to get involved at http://www.neotists.co.uk/