Cambridgeshire Railway Usage Statistics: The Inside Track
The Office of Rail and Road (ORR) publish yearly (Apr-Mar) usage estimates for railway stations in Great Britain, which we have used to produce the following data story. In the absence of a fully gated railway network, these statistics (which are based on recorded tickets sales), represent the most accurate estimates available. Limitations of the dataset, as well as enhancements which have been periodically made to the methodology, should be considered when interpreting the data, particularly when making comparisons over time. Details of the methodology and any changes implemented are outlined in the yearly methodological reports which can be found alongside the national data here.
The local data can be accessed and downloaded directly from the Cambridgeshire Insight Open Data Portal here.
Cambridgeshire and Peterborough Rail Usage
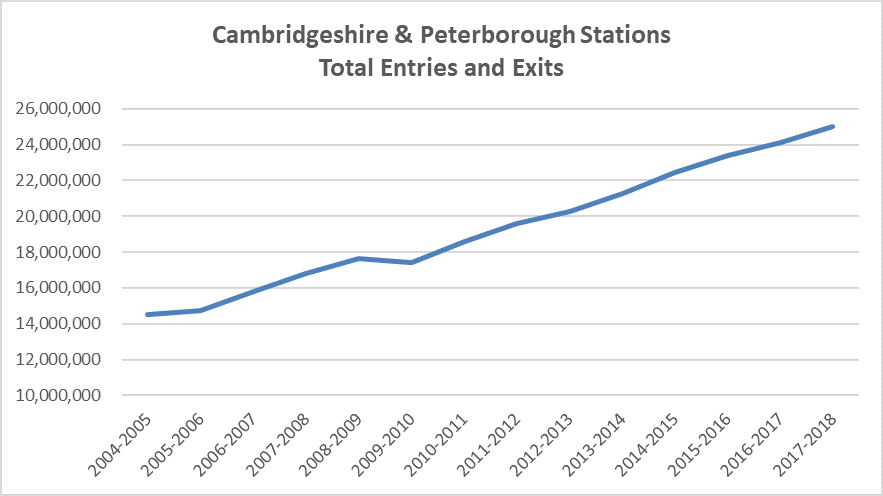
The most recent data shows that there were over 25 million entries & exits in 2017/18 across all railway stations in Cambridgeshire and Peterborough.
The below map displays ranges in the volume of passengers for 2017/18 by individual station. Cambridge is the busiest railway station in the whole East of England region with over 11.5 million entries & exits in 2017/18. This ranks Cambridge as the 35th busiest station in Great Britain. The map also shows that the Peterborough to London King’s Cross line is one of the busiest in the area with 3 high usage stations – Peterborough, Huntingdon and St. Neots, all seeing over 1 million entries & exits. A new station Cambridge North opened on 21st May 2017. Despite not being open for the full recording year, there were over 488,000 entries & exits in 2017/18 making it the 7th busiest station in Cambridgeshire and Peterborough .

Changes Over Time
The graph below shows that there has been rapid growth in train station usage in Cambridgeshire, apart from a fall in 2009/2010, when overall usage figures decreased nationally.
The graph below shows the yearly total number of entries and exits across all stations in each district. It indicates that Cambridge has been driving the overall growth.

The following graphs allow us to explore the changes in passenger numbers over time for all of the individual stations in Cambridgeshire and Peterborough. For ease of interpretation they are broken down by number of entries and exits into low (under 150,000), medium (between 150, 000 and 1 million) and high (over 1 million) usage stations.

The first graph (above) shows that, aside from Cambridge, growth has been relatively flat in recent years at the high usage stations. Total numbers grew by 0.9% at Cambridge station between 2016/17 - 2017/18, which is a much lower growth rate compared to the previous three years, likely linked to the transfer of passengers to the new Cambridge North station in May 2017. Indeed, the combined figure for Cambridge North and Cambridge Stations is very close to what the projected growth figure would have been for just Cambridge (based on an average of 5.2% growth over the previous three years).
This is very much a baseline year for Cambridge North but the initial 'switching' of the projected growth in passenger numbers to the station is very encouraging indeed. Relief has been provided to the main station and there have been obvious benefits to passengers working in north Cambridge in term of convenience and shorter commute times. Hopefully, the full additional benefits from the development of Cambridge North will be demonstrable as the station grows beyond this initial volume.

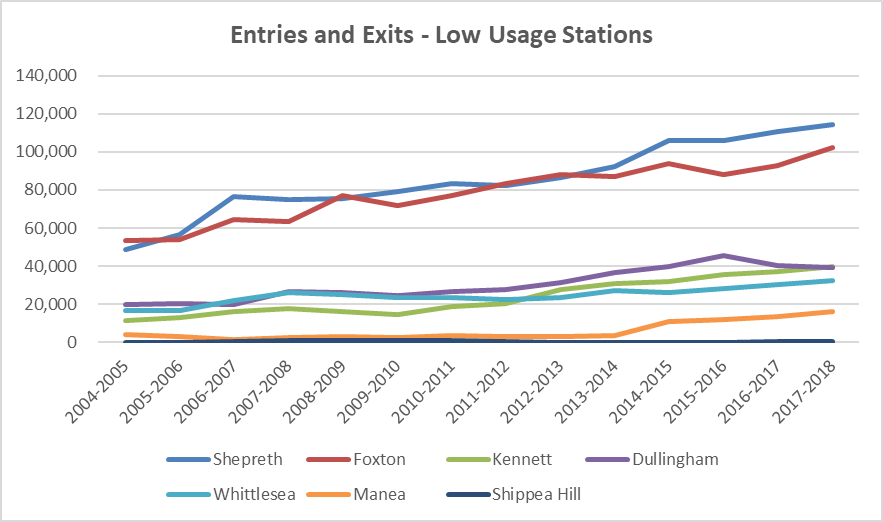
Looking specifically at the low usage stations, the graph below shows that entries and exits have been increasing in recent years, apart from at Dullingham station where numbers have decreased since 2015/16. There is a significant increase at Manea in 2014/15 which corresponds with service improvements that were implemented in December 2013.