Stories
54 Stories
High fuel costs - low income-New fuel poverty data available
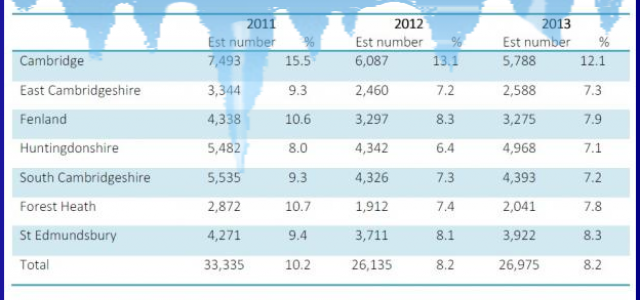
In May 2014, the Department of Environment and Climate Change (DECC) released new estimates of the number and proportion of households across the country living with high fuel costs and low incomes.
Over the last decade there has been increasing need for all publicly owned organisations to give access to information which is held due to the Freedom of Information (FoI) Act 2000.
FOI
The population of Cambridgeshire is forecast to grow by approximately 25% between 2013 and 2036 (Cambridgeshire Research Group’s 2013-Based Population Forecasts). The rise in population will be driven in part by significant housing developments within the County.
What is this all about?
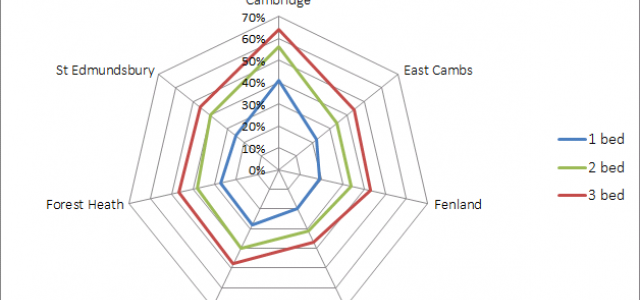
Each year, housing partners work together to update our understanding of the housing market locally. Part of this assessment includes looking at housing affordability.
So you know a new system of Individual Electoral Registration (IER) came into force (10 June 2014) and that each person is now responsible for registering themselves to vote, rather than the old system where the head of household registered everyone.
Solid information on population counts by region and sub-region is vital for the ongoing local planning of services, such as schools, children’s centres and transport provisions and infrastructure.
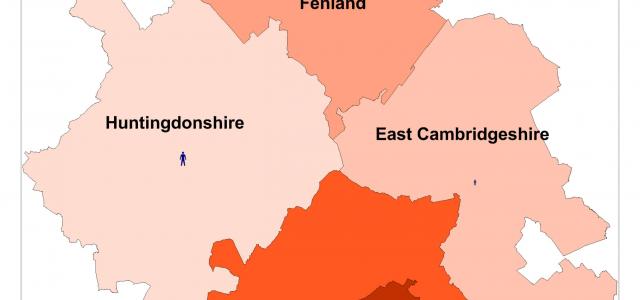
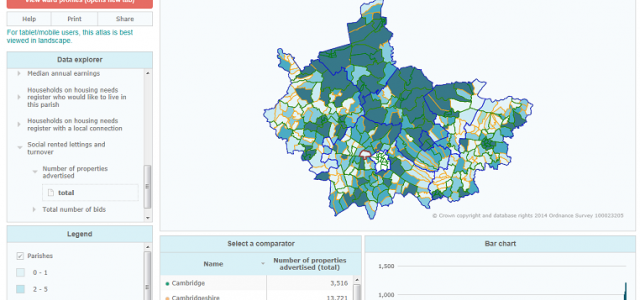
The Cambridge sub-region housing profiles show information about housing stock, households and data about affordable housing demand at a parish or ward level.
QUESTION
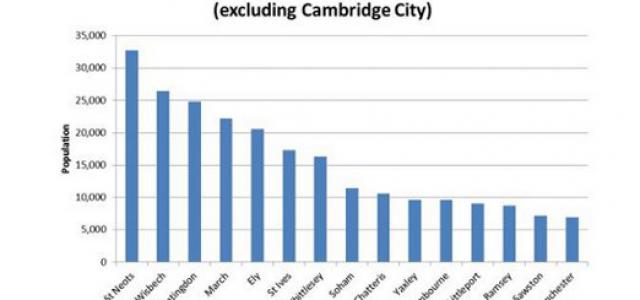
Each year I have to visit every home in Cambridgeshire. Is there anything you can do to help me plan my visits? Where are the most populated areas in the county, from the largest city to the smallest hamlet, which I must remember to visit?

