Data Story Series, Episode 3: Understanding dependency on the car

We’ve previously posted on what the results of the Autumn 2017 'Big Conversation' have told us about cycling and bus travel in and around Cambridge. In this final blog we have a look at what the data can tell us from a car driver’s perspective (see previous posts for full commentary on the methodology).
The first thing that we focused upon within our secondary analysis was on commuting trips for people working within the core of Cambridge, CB1 to CB5 postcode districts. St Neots (PE19 area) was most dependent on the car for commuting to Cambridge with 83% of the commuting flow being car journeys.
Indeed, it was apparent from the data that a number of the area’s market towns are dependent on the car to commute to Cambridge. These include Newmarket, Haverhill, Linton (and area) and Huntingdon.
There are differences where viable public transport alternatives exist. For St Ives (PE27), the area served by the Guided Busway (see also previous blog post on bus usage) dependency on the car to commute to Cambridge is much less. This is also the case for Royston and Ely which are served by traditional rail services.
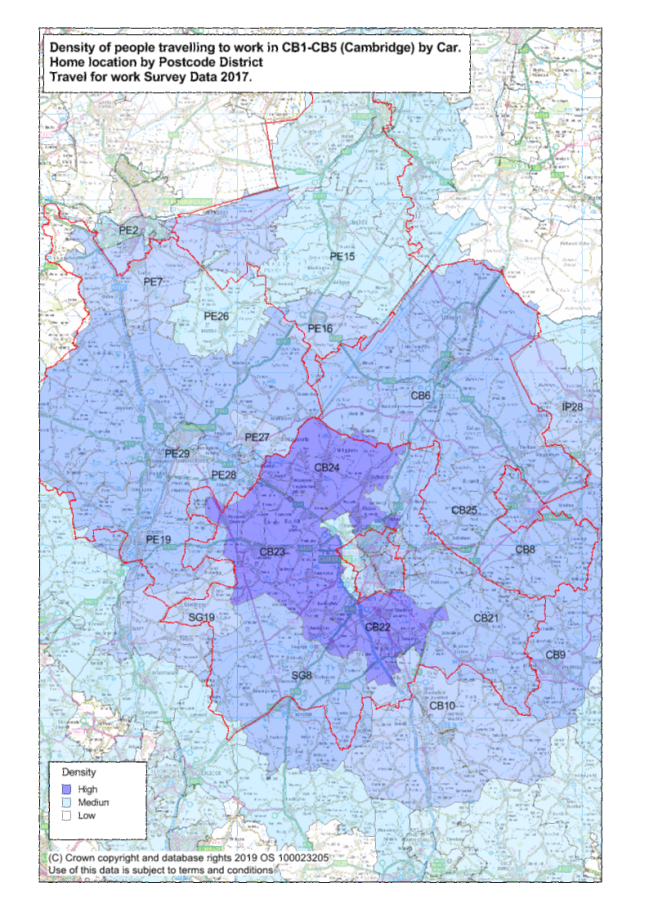
We also looked at the volume of car journeys.

The map image above reflects one of the conclusions we reached from the data, that the smaller settlements that immediately around Cambridge, particularly those from the North-West, West and South-West of the City collectively contribute a considerable number of car journeys.
Finally, one of the oddities that the data throws up are places where the split is relatively even. The commuting journey from CB22 (Sawston and area south of Cambridge) to CB2 (a wedge of Cambridge from Trumpington / Addenbrookes into the city centre) has a relatively equal split between people travelling by bike or car. This perhaps shows the value of extending cycling infrastructure outside of the city into the surrounding settlements
